 Products & Services
 Introduction of the GDF Reservoir geological analysis series
1.The system of single well profile analysis
2.The system of Multi well profile analysis
3.The system of Comprehensive geological profile analysis
4.The system of Multi-well correlation oriented stratigraphic analysis
5.The system of reservoir connectivity analysis
6.The system of Sedimentary facies analysis
7.The system of Development status maps analysis
8.The system of contours analysis
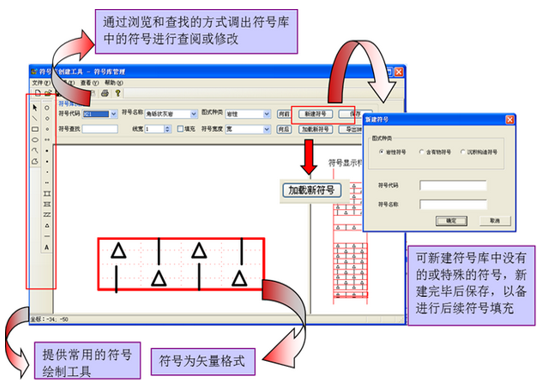
9.The management of symbol library
Characteristics of the GDF Reservoir geological analysis series
1.The operation is Simple and flexible,e.g. the Site - wide key to generate the illustration.
2.The linkage between maps and data.
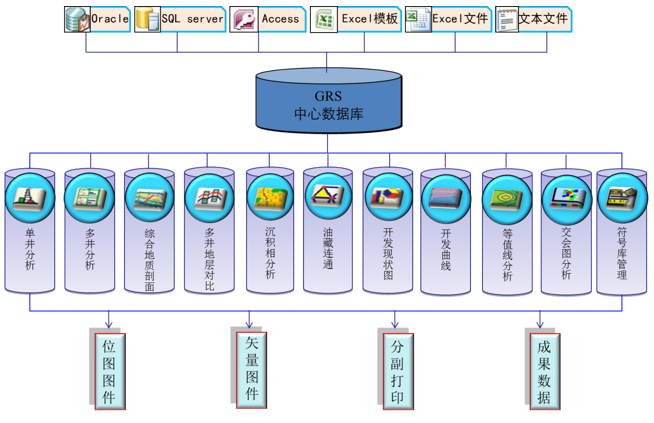
3.The sources of data are varied.e.g. Oracle、SQL Server data library、Excel、text file
4.The way of data loading is convenient- copy and paste the files,match to the data, generate maps.
5.The industry - standard maps are clear and beautiful.
Characteristics of each module:
Comprehensive geological profile
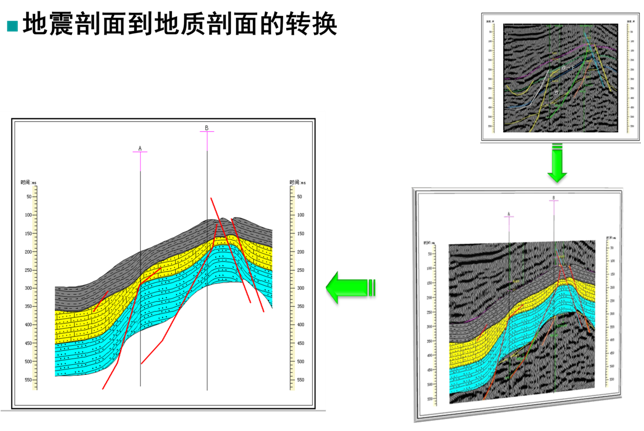
Create lots of profiles simultaneously, interpret point closure of profiles; describe fault displacement accurately;draw the trace of deflecting or horizontal well; Accomplish the transformation from Seismic sections to geologic sections
·Multi-well correlation oriented stratigraphic
The Multi-well are operating linkage,and correlating automatically.
·reservoir connectivity maps
The solid topological Line of Section can be shown with various angles by rotating or dragging
·Sedimentary facies analysis
Single Well Face Analysis,Planar graph of sedimentary facies automatic generating,the linkage of points,lines and planes;Application of the Seismic Slice data in subdividing sedimentary facies.
Workflow of the software
Details of the software
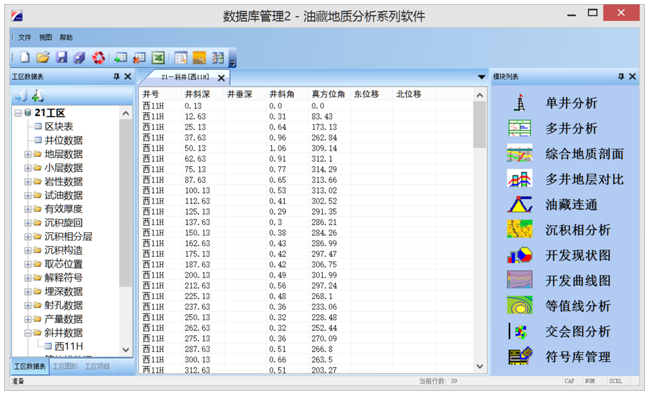
Support multiple work area projects,modules are clear.
Module 1. The system of single well profile analysis
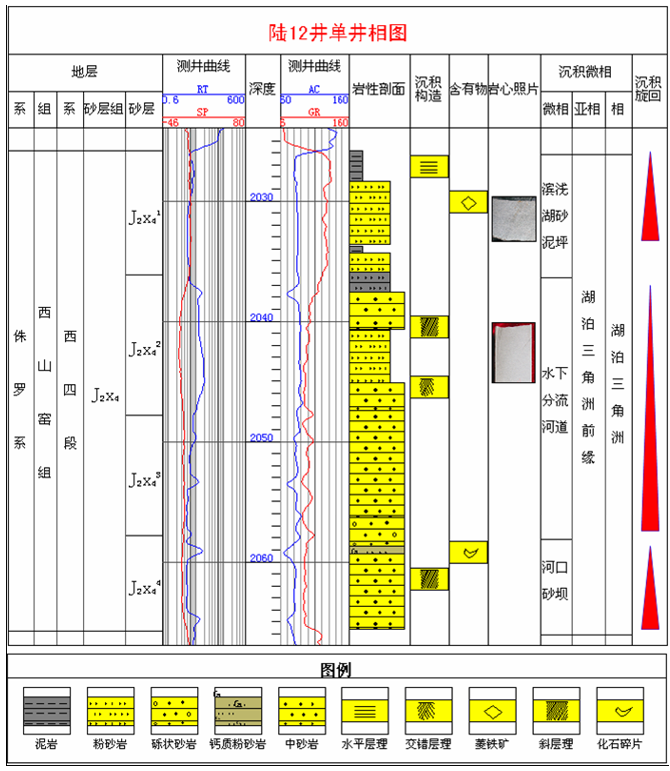
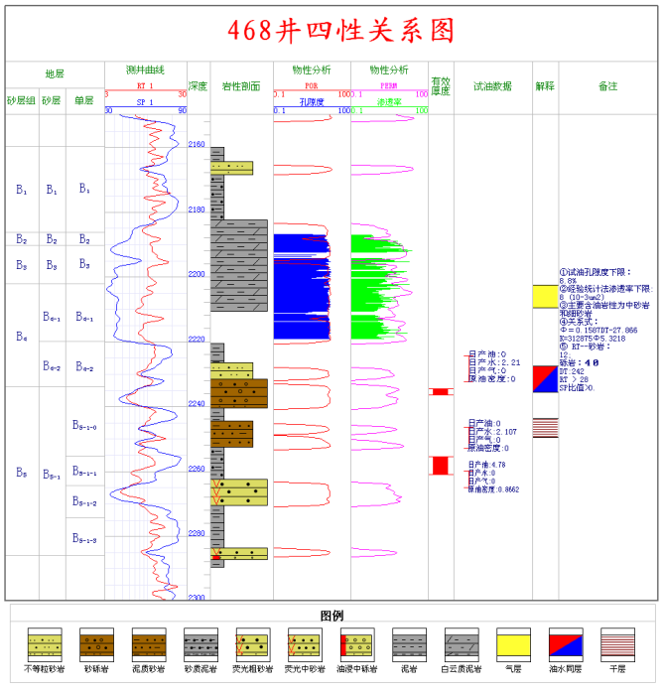
This module can generate all analysis maps about the single well-comprehensive columnar section,four-property relationship graph, single well profile analysis graph,comprehensive logging graph,geochemical pyrolysis graph and user-defined graph.It should be made application for single well analysis,well design etc..
-Characteristics
1.It could generate maps with template or user-defined,the single well graph could save as template.
2.Adjust the stratigraphic conveniently,overall recognize the superscript or subscript of stratigraphic,the linkage between maps and data.
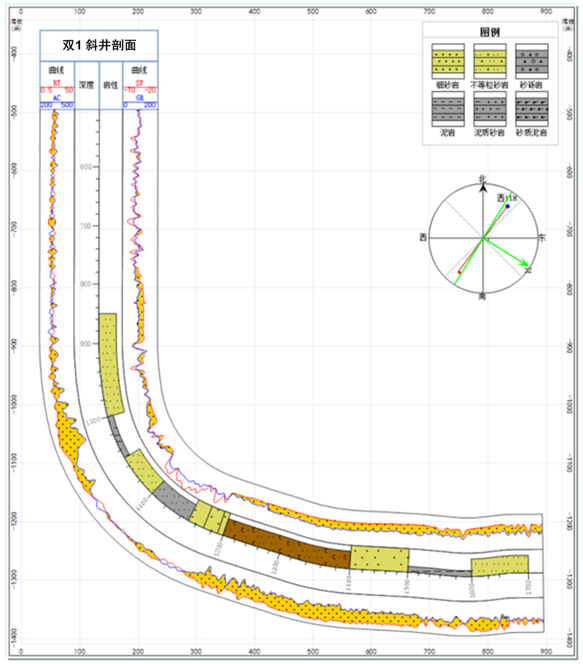
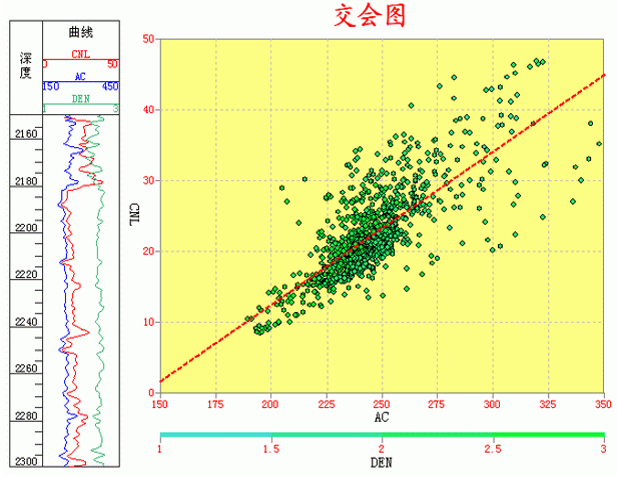
3.Add new crossplot conveniently,make deflecting well profile graph.
4.The lithologic symbol can be modified,merged,deleted and shown as equal distance or unequal.
5.The logging curve could be boundary filled,threshold filled,color code filled and dragged,compared.
6.Extract part of logging curve data, do detailed analysis, lithology interpretation, statistics and edit.
7.Calculate the shale content with only GR or SP logging curve.
8.Calculate the porosity with CNL, DEN or AC logging curve.
9.Analysis and calculate porosity of single well profile
10.Define sedimentary facies standard model of logging curve,for sedimentary facies identification.
11.Using logging curve data to calculate the porosity, shale content and formation permeability.
12.Showing the physical property by stick or curve.
13.Add the sedimentary structure, content symbols, pictures or extract them in data form flexibly and conveniently.
14.Edit the well testing result,coring, effective thickness, sedimentary cycle or extract them in data form or extract them in data form flexibly and conveniently.
Effect drawing:
Module 2.The system of Multi well profile analysis
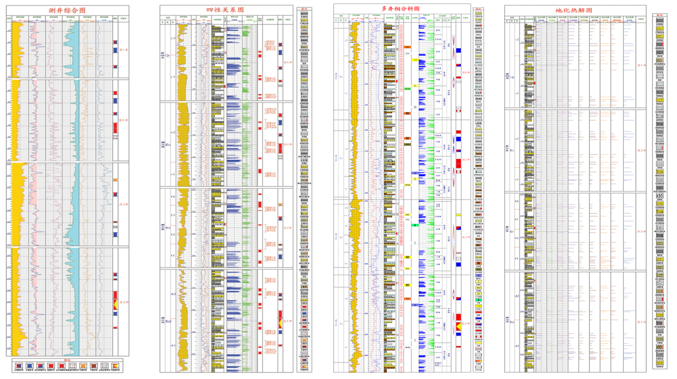
The system of Multi well profile analysis is based on the system of single well profile analysis.It add basin and bending comprehensive columnar section.This module can draw”Multi well four-property relationship graph with the same calibration”,”sedimentary facies graph”,which are based on Multi well comprehensive columnar section.
-Characteristics
1.Inherited simple, flexibility function and edition of “single well profile”.
2.Load the data with multi well whole management.
3.Screen the representation well based on target zone selection.
4.Add or delete the representation well or its trace conveniently.
5.Edit the multi-well picture trace with concerted linkage.
6.convenient for users to do parameter adjustment,the header of each well could switch.
7.The output of Multi well profile is integrated, convenient for saving or printing.
Effect drawing:
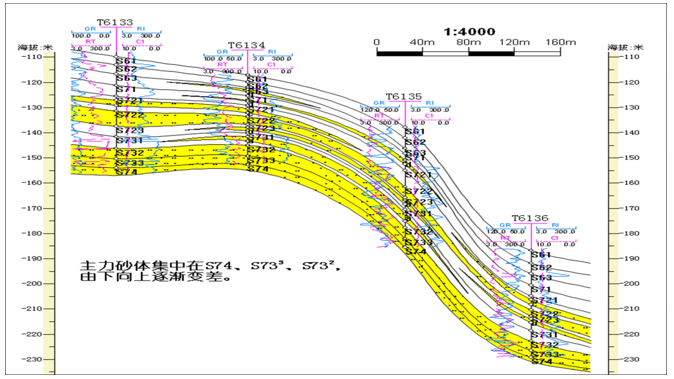
Module 3.The system of Comprehensive geological profile analysis
Using the data of regional geology, well logging, mud logging, hole deviation, structure, seismic interpretation, connecting the Well in their physical location by stratified data automatically. For Multi well correlation oriented stratigraphic,generate stratigraphic correlation graph, structural section map, lithology profile map, reservoir profile map etc..
-Characteristics
1.Well select visualization,this soft could select multiple profiles concurrently and generate the sections automatically.
2.Add or edit lens, layers, faults, oil/water interfaces.
3.Draw the traces of inclined shafts or horizontal well,and Show the logging curve on the trace at the same time.
4.Draw the traces of inclined shafts or horizontal well,and Show the logging curve on the trace at the same time.
5.Edit conveniently by horizon smoothing.
6.Dynamic display all well data for real-time.
Effect drawing:
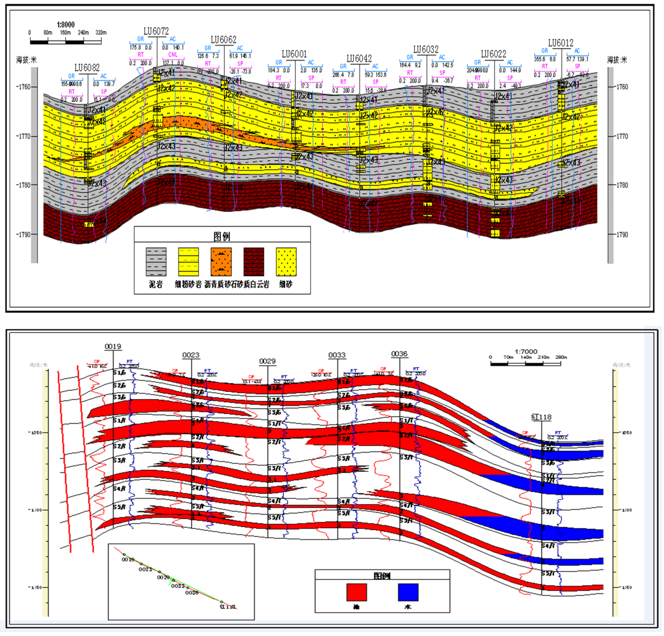
Fine reservoir section
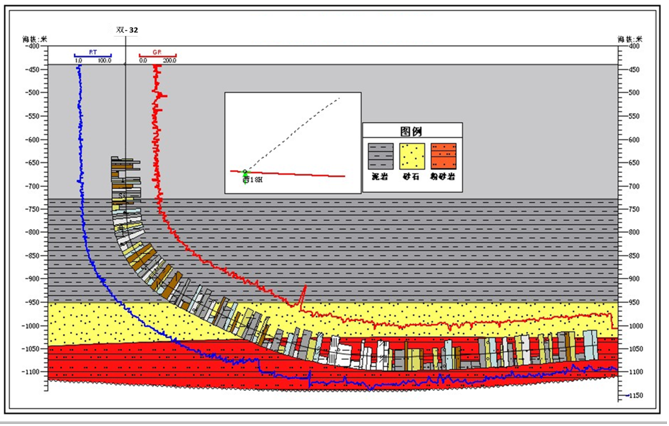
Horizontal well section
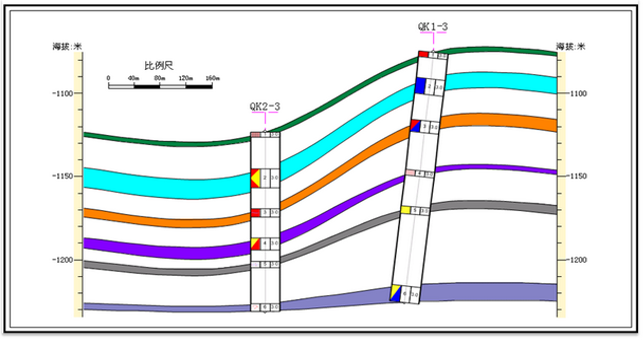
Horizon interpretation
Module 4. The system of Multi-well correlation oriented stratigraphic analysis
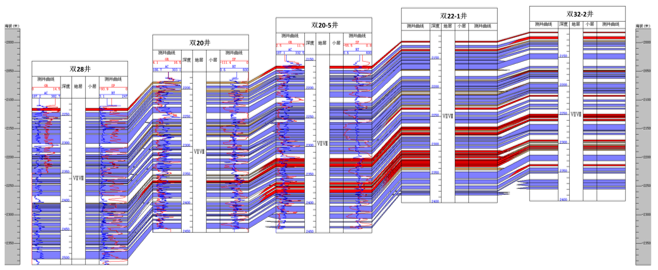
The system of Multi-well correlation oriented stratigraphic analysis is a module for stratigraphic correlation of multi-well.It based on the correlation of logging curves,the name of the stratigraphic and the location in the layer.
-Characteristics
1.With all the picture traces and editing fuctions of single well, adopt the depth or elevation mapping mode.
2.Compare curves and layers automatically or manually, add,delete, setting position of picture traces discretionarily.
3.All contents of the well picture traces are linkage.
4.Compare multi-well layers totally or locally based on the correlation of logging curve.
5.Compare multi-well integrally by station interval and layer name.
6.Flat multi-well layers with some layer, displayed by depth or elevation.
7.Add pictucre traces,layers or wells conveniently.
8.Display or hide the horizon line,layer trace.
9.Display the productivity of monolayer.
Effect drawing:
Module 5. The system of reservoir connectivity analysis
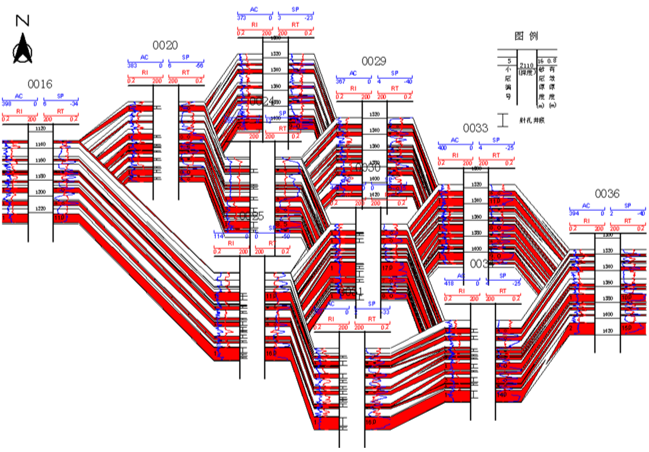
Using the well coordinate data,logging data, geotechnical data, well testing data, physical property of reservoir etc., display the spatial distribution of reservoir and liquid by spatial topological relation in 3D form; analysethe relativity of each layer for studying the Connectivity and distribution law of the reservoir, provide geological basis to reservoir evaluation, adjustment of development plan, pattern modification etc..
- Characteristics
1.Well select visualization,Compare the logging curves discretionarily, generate the connected graph automatically.
2.Support data and picture association,load the logging curves integrally.
3.Display in 3D form,the oil-water relationship is clear.
4.Delete the occlusion profile discretionarily,convenient for step-by-step observation .
5.Rotate the viewport discretionarily to analysis the oil-water relationship.
6.Add or edit the horizon line, pitching-out line, jagged line and oil/water interface etc..
7.Display the lithology profile, logging curve, perforation symbol for stratigraphic correlation graph.
Effect drawing:
Module 6. The system of Sedimentary facies analysis
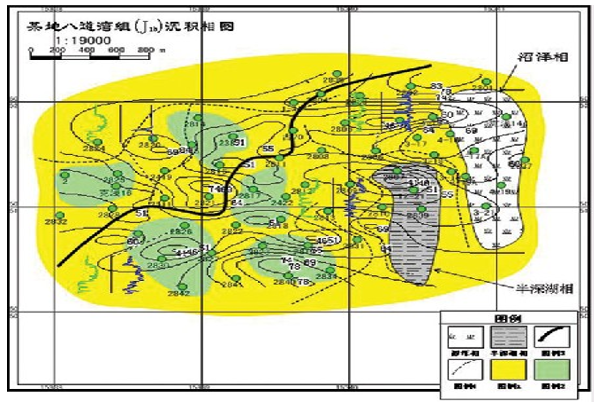
sedimentary facies analysis system: Using the well coordinate data,logging curve data, geotechnical data, layer data etc., combine with the geologic comprehensive research,obtain the data of sigle well microfacies analysis, sand content etc.,for sedimentary facies analysis, sedimentary outline draught.It’s a software for geologic comprehensive research and reservoir description.
Characteristics:
1.Well select visualization,select the well automatically or manually, demarcation of electrofacies zonation boundaries, generate the isoline automatically.
2.Electrofacies zonation with sedimentary facies standard model of logging curve.
3.Generate thelithology profile accurately with sedimentary microfacies and sedimentary cycle of single well .
4.Classify the sedimentary facie by sedimentary microfacies of logging automatically.
5.Edit the sedimentary facies in a single well,section and plane,and these three could interact conveniently.
6.Display or hide the well, lithology profile ,logging curve, isoline etc. by layer control.
7.Load the curve integrally,add or connect the well manually,and display the production data.
8.Provide large-batch sedimentary facies symbols which could user-defined and expaned.
Effect drawing:
Module 7. The system of Development status maps analysis
The development status graph use the line chart,histogram, pie mapping, semicircle diagram to express development status of different period,different fluid property.It could demonstrate daily, monthly,yearly and cumulative production respectively.
-Characteristics:
1.Well select visualization,select the well automatically or manually, demarcation of well selection boundaries, generate the isoline automatically.
2.Generate the oil-gas-water production graphs automatically.
3.Load the oil-gas-water production graphs on the base map directly.
4.Switch the different type of development status graph by” graph style Selectorswitch”
5.Add the editing object,like character,linetype, region, annotation etc..
6.It can easily adjust the proportion of the plane.
7.The operation is simple and mapping conveniently.
8.Generate the standard coordinate frame,the scale and illustrations etc. automatically.
Effect drawing:
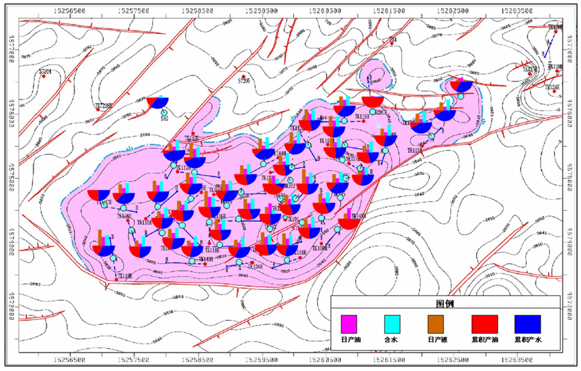
Histogram semi-circular combination chart
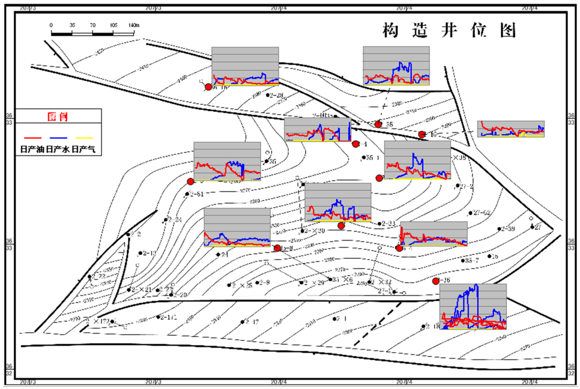
Yield trend graph
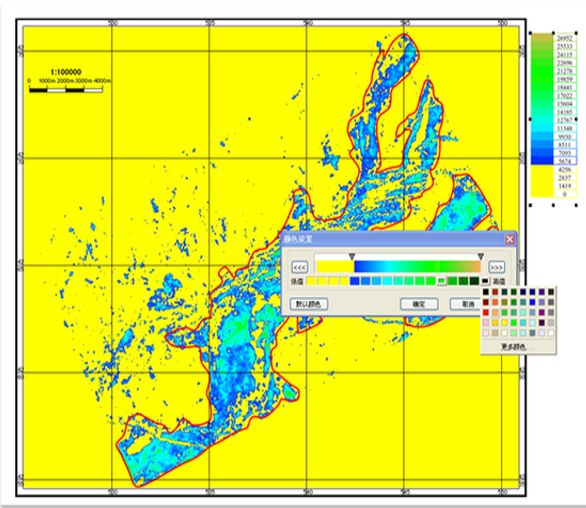
Module 8. The system of contours analysis
Isoline analysis system use the well coordinate data, formation thickness data, formation physical property data(sand content, porosity and permeability etc.), generate the isoline automatically. It’s a isoline software for geologic comprehensive research and reservoir description.
-Characteristics:
1.Well select visualization,select the well automatically or manually.
2.Generate the isoline automatically with spline interpolation for automatic smoothing.
3.The isoline,annotation and the type of the isoline could be edited flexibly.
4.Auto-stuffing, edit the color gamut by real-time.
5.Generate the standard coordinate frame,the scale etc. automatically.
Effect drawing:
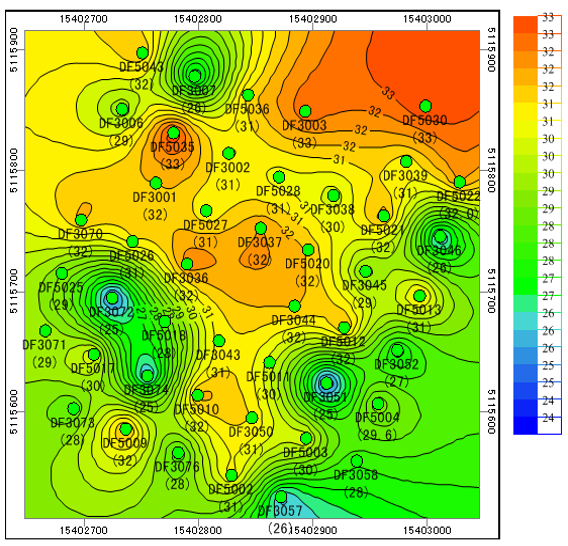
Porosity isopleth map
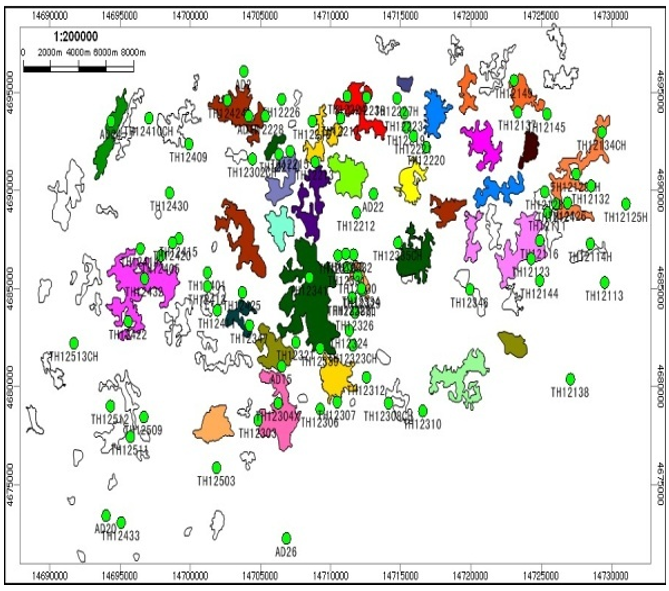
Fracture-cave unit graph
Module 9. The management of symbol library
The symbol editing module provides editing and management function of lithologic,content, sedimentary structure symbol.It could create new document of lithologic,content, sedimentary structure symbols with user requirement based on the existed symbol library,the symbol in symbol library could be edited,modified or deleted.
Effect drawing:
